Visualisation and Documentation
The XML specification of an SADF graph can be visualised or documented in more intuitive forms.
Graph Visualisation
| Tool | sdf3print-sadf --format dot | API | SADF2DOT() |
|---|---|
This feature converts the XML specification of an SADF graph into the dot format, which can be converted to other formats like jpg, ps or png. Using tools like dotty, the graphical structure of an SADF graph can be represented with a picture.
Graph Documentation
| Tools | sdf3print-sadf --format html sdf3print-sadf --format php |
API | SADF2HTML() |
|---|---|
This feature allows elaborate documentation of SADF graphs in html or php format. Below, two example SADF graphs are shown that have been visualised using the php option. You can click on each object (process or channel) in the pcitures to see the properties of that object in detail.
MPEG-4 SP Decoder (XML Specification)
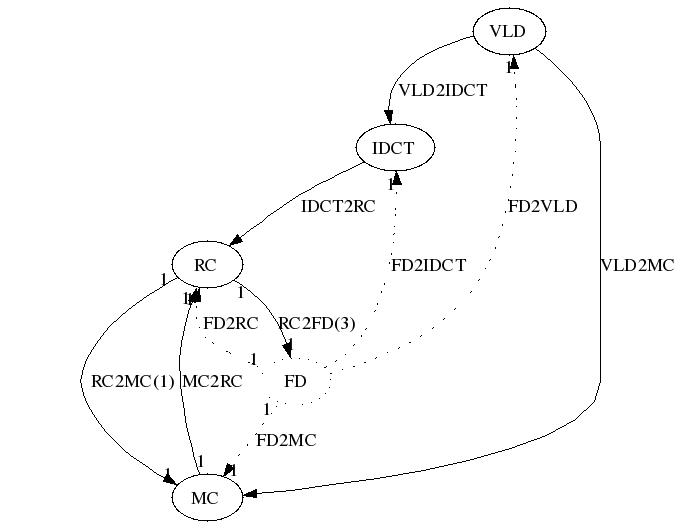
Warning: Undefined array key "id" in /var/www/html/sadf/visualisation.php on line 101
Fatal error: Uncaught Error: Undefined constant "VLD" in /var/www/html/sadf/visualisation.php:103 Stack trace: #0 {main} thrown in /var/www/html/sadf/visualisation.php on line 103
Click on an object in the image to see its properties
Warning: Undefined array key "id" in /var/www/html/sadf/visualisation.php on line 101
Fatal error: Uncaught Error: Undefined constant "VLD" in /var/www/html/sadf/visualisation.php:103 Stack trace: #0 {main} thrown in /var/www/html/sadf/visualisation.php on line 103